Digital Transformation Consulting: Cost, Strategy,...
October 13, 2025

Data visualization plays a crucial role in understanding and communicating insights from data. Python, being a versatile programming language, offers numerous libraries for creating visualizations. Among them, Bokeh stands out as a powerful and user-friendly library that allows you to build interactive visualizations with ease.
Bokeh is an open-source Python library specifically designed for creating interactive visualizations for modern web browsers. It enables you to generate rich, interactive plots, charts, and dashboards that can be easily shared and deployed across different platforms. Whether you’re a data scientist, web developer, or data enthusiast, Bokeh provides a comprehensive set of tools to help you bring your data to life.
With just a few lines of Python code, Bokeh enables you to create interactive, JavaScript-powered visualizations displayable in a web browser.
Its workflow involves two stages selecting visual building blocks and customizing them. Bokeh integrates a Python library responsible for defining visualization content and interactivity with BokehJS, a JavaScript library that handles the display in web browsers. Bokeh automates the generation of JavaScript and HTML code and supports the loading of supplementary JavaScript from Bokeh’s CDN for enhanced functionality.
Bokeh’s documentation consists of several elements, including the user guide with detailed explanations and examples and the reference guide that systematically describes every element of Bokeh. In this guide, you will find links to both those resources.
To start using Bokeh, you need to install it via pip, a package manager for Python. Once installed, you can import Bokeh in your Python script or Jupyter Notebook and begin creating visualizations.
Bokeh provides multiple interfaces for creating plots. The most used interface is the ‘bokeh.plotting’ module, which offers a convenient way to define and customize visual elements. You can create plots, add data, and configure various plot attributes such as titles, axes, legends, and tooltips.
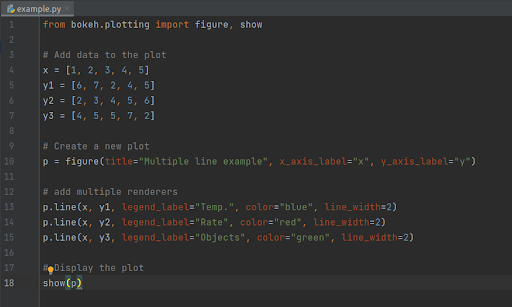
Bokeh follows a declarative approach, allowing users to define plots and visual elements using a concise syntax. Here’s a simple example to illustrate the basic usage of Bokeh:

When you execute these lines of code, Bokeh creates an output file “example.html”. Bokeh also opens a browser to display it.
See the results in browser:

Similarly, Bokeh can be capable of creating such interactive visualizations for the web.

Conclusion:
Bokeh is a powerful Python library that empowers users to create interactive visualizations for the web. With its intuitive API and extensive customization options, Bokeh enables you to create visually appealing plots, charts, and dashboards that engage and inform your audience. Whether you’re exploring data, presenting insights, or building web applications, Bokeh is a valuable tool in your data visualization toolkit. By leveraging Bokeh’s capabilities, you can effectively communicate complex information, uncover hidden.