Crypto Wallet App Development: Features,...
April 14, 2025

React is a popular JavaScript library for building web application user interfaces. While developing with React, developers face various issues that can be solved with strong debugging skills. By effectively troubleshooting and resolving these problems, developers can save time and deliver high-quality React applications.
Common issues during React development include syntax errors, rendering problems, state management challenges, runtime errors, event handling issues, lifecycle method errors, prop type mismatches, dependency conflicts, routing problems, styling and CSS issues, and API integration problems. To resolve these issues, developers should read error messages carefully, use debugging tools, and consult React’s documentation and community resources.
Improving debugging skills allows developers to quickly identify and fix problems, enabling them to overcome challenges efficiently and deliver high-quality React applications.
Debugging is essential for React developers, especially as projects grow more complex. In this blog post, we will explore advanced debugging tips and tricks for React applications. Our aim is to equip you with the knowledge and tools to tackle even the most elusive bugs.
Strong debugging skills are essential for React applications. Techniques like console logging, browser tools, and React Developer Tools can help address issues like unexpected behavior, state management challenges, slow rendering, and complex data flow. Error boundaries and the React Profiler aid in error handling and performance optimization. By effectively applying these debugging skills, developers enhance functionality and boost React application performance.
By refining your debugging skills, you’ll be well-prepared to navigate the complexities of React application development and deliver robust and efficient solutions. So, let’s dive into the world of debugging React applications and uncover the secrets of bug hunting!
Read more: Best App Ideas using reactJS
Console.log in React helps debug code by logging information to the browser’s console. It tracks variables, checks function execution, and inspects values during runtime.
Power of console.log:
Outputting Information: Console.log easily displays messages, variables, objects, and other data types in the console.
Real-Time Insight: Placing console.log strategically reveals real-time insights, tracking execution flow, variable values, and component/function interactions.
Problem Diagnosis: Console.log helps diagnose issues by logging relevant data such as function parameters, intermediate values, or error messages.
Tracking Code Execution: By logging messages at key points like lifecycle methods or event handlers, console.log enables tracking and validation of code execution.
Iterative Development: Console.log aids in iterative development by logging values and verifying code output, facilitating incremental adjustments and validation.
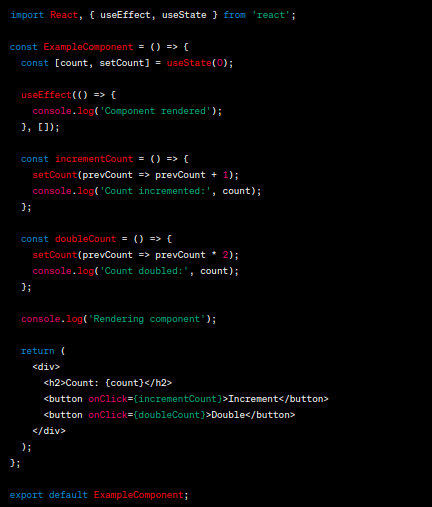
In this example:
React Developer Tools is a browser extension that helps developers debug React applications. It offers a range of features to understand, inspect, and manipulate components and states. Here’s how it aids in debugging large-scale applications:
Component Hierarchy: Provides a tree view of all components, helping understand complex hierarchies.
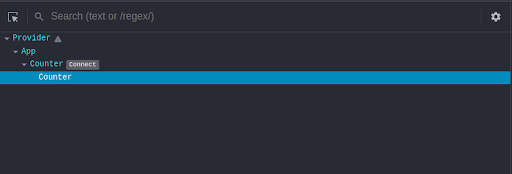
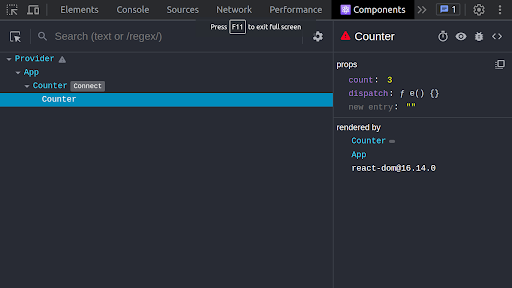
Component Inspection: Allows inspection of individual components, including props and state.
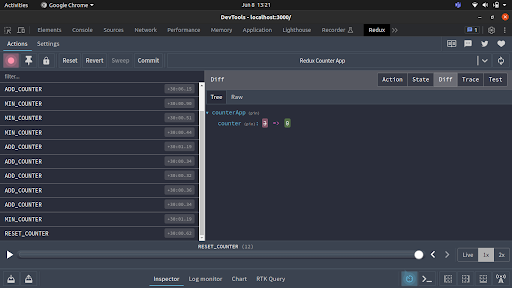
State Management: Integrates with popular libraries like Redux to inspect and track state changes.
Component Highlighting: Highlights and inspects specific components for easy identification.
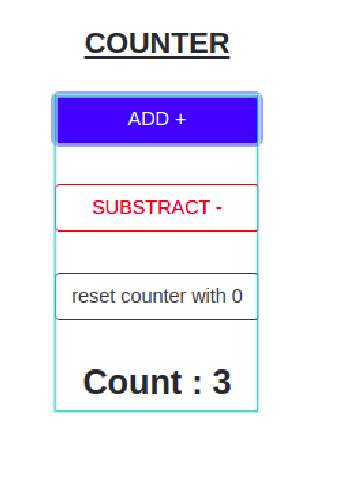
Time-Travel Debugging: Enables rewinding and replaying actions and state changes for bug tracking.

Performance Profiling: Measures render times, identifies re-renders, and detects performance bottlenecks.
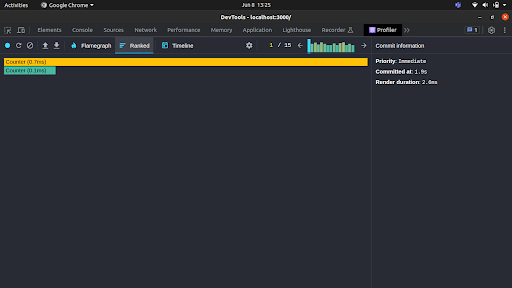
React Developer Tools empowers developers by providing insights into React applications, assisting in understanding hierarchies, inspecting states and props, tracking changes, identifying performance issues, and debugging complex scenarios. These capabilities are valuable for extensive and intricate codebases in large-scale applications.
They are useful in building large-scale applications, especially for handling errors in complex components, external dependencies, or asynchronous operations.
React Strict Mode is a developer tool that detects and flags potential problems in a React application. It applies strict checks and warnings to identify common mistakes and performance issues, helping developers address them during the development process.
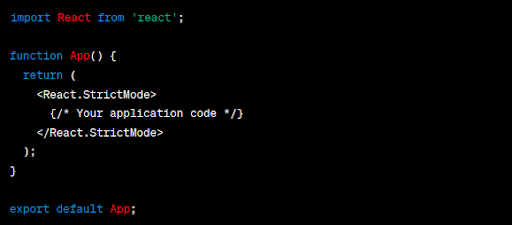
React Strict Mode helps in the following ways:
Identifying Unsafe Practices: Detects and warns about unsafe lifecycle methods, deprecated features, and potential issues in your codebase.
Highlighting Side Effects: Detects unexpected side effects during component rendering, helping you identify and fix unintended consequences.
Catching State Mutation: Warns about state mutations, ensuring a more predictable and maintainable application state.
Detecting Deprecated Features: Alerts about deprecated features, encouraging updating code to utilize recommended alternatives.
Performance Warnings: Provides performance-related warnings, optimizing application rendering performance.
When debugging asynchronous operations in a React application, there are several important points to consider. Here are some key aspects to look into:
API Calls: Use console.log or debugger before and after making requests. Check the browser’s “Network” panel for details.
State Management: Console.log or debugger where state changes occur. Use browser tools or extensions for deeper inspection.
Promises: Log resolved values and handle errors using console.log or debugger within “then” and “catch” methods.
Async/await: Set breakpoints on “await” lines to inspect variables. Use try-catch blocks for error handling.
Timer-based operations: Place console.log or debugger in timer callbacks to understand timing and code execution.
Combine techniques and tools like console.log, debugger, and browser developer tools for effective debugging.
To improve your React application’s performance, follow these steps:
Add console.log statements: Place console.log statements in important parts of your code, such as lifecycle methods, event handlers, or useEffect hooks. Log relevant data like props, state, or variable values to track execution flow and observe data changes.
Examine prop flow: Analyze how props are passed down the component tree. Avoid unnecessary drilling of props through intermediate components, as this can cause unnecessary re-renders. Optimize performance by using techniques like React.memo or shouldComponentUpdate to prevent re-rendering when props or states haven’t changed.
Use performance profiling tools: Take advantage of performance profiling tools available in your development environment. Measure CPU usage, memory consumption, and network requests to identify potential bottlenecks. Optimize your code based on the insights gained from profiling, ensuring an efficient and responsive React application.
By implementing these techniques, you can gain valuable insights into a component flow, optimize performance, and create an efficient and responsive React application.
React Developer Common Errors & Solutions:
Syntax Errors: Review and fix typos, missing brackets, or incorrect syntax in your code.
Rendering Issues: Check component rendering logic, lifecycle methods, and props/state usage.
State Management Issues: Review state management approach, initialize/update state properly, and ensure correct state access.
Undefined or Null Errors: Handle cases where variables or properties may be undefined or null.
Event Handling Issues: Double-check event handlers bind ‘this’ correctly, and access event properties properly.
Prop Type Mismatches: Define and enforce prop types to ensure correct data types.
Analyze Network Requests: Use browser network tools to inspect API requests and responses.
Dependency Conflicts: Carefully manage dependencies, ensure compatibility, and resolve conflicts.
API Integration Problems: Review API integration code, check endpoints, format data correctly, and handle responses/errors appropriately.
Remember to analyze error messages, refer to documentation, and seek community resources for solutions. Experience and practice will enhance your ability to identify and resolve these common React errors.
Testing your React application in different environments and browsers is crucial for debugging and improving your code. It offers several benefits:
Bug Reproduction and Isolation: Testing in various setups helps reproduce and isolate bugs that may be specific to certain environments or browsers. This aids in understanding the root cause and finding solutions.
Browser-Specific Issue Identification: Different browsers have their own quirks and behaviors that can affect your React application. Testing in multiple browsers helps identify browser-specific issues, allowing you to address them appropriately.
Performance Optimization: Testing in different environments and browsers reveals performance bottlenecks that may be specific to certain setups. This enables you to optimize areas of your code and improve overall performance.
Accessibility Testing: Testing with screen readers and accessibility tools in different environments ensures your application meets accessibility standards. It helps identify and address any accessibility-related issues for better usability.
Cross-Platform Compatibility: Testing on different platforms ensures your React application works consistently across devices and operating systems. It helps identify platform-specific bugs or limitations, allowing you to provide a seamless experience for all users.
ESLint and Prettier are essential tools for maintaining code quality and catching errors in React projects. They offer several benefits:
Consistent Code Formatting: Prettier ensures that all developers follow the same code style, reducing the chance of introducing syntax errors or logic mistakes caused by inconsistent code structure.
Syntax and Logic Errors: ESLint analyzes your code and identifies common errors and potential bugs, such as undeclared variables, unused variables, missing dependencies, and incorrect function usage. Catching these errors early helps prevent bugs or quickly identify their source during debugging.
Best Practices and Code Quality: ESLint checks your code against best practices and coding standards, helping to avoid common pitfalls. It enforces guidelines like consistent naming conventions, avoiding deprecated APIs, and the use of React hooks.
Custom Rules and Plugin Support: ESLint is highly configurable and extensible. You can customize rules to align with your project’s requirements and install plugins that provide specialized rules for React. These customizations help catch React-specific issues and improve code quality.
Conclusion:
Debugging React applications can be challenging, but with the right techniques and tools, developers can effectively identify and resolve issues. In this post, we explored advanced tips for debugging React apps, including console logging, React Developer Tools, Error Boundaries, strict mode, and more. By following these steps, you’ll improve your ability to tackle complex bugs and enhance the quality of your React applications. Remember to be patient and persistent during the trial-and-error process of debugging. Analyze error messages, consult React’s documentation and community resources, and practice regularly to become a proficient debugger. With experience, you’ll gain a deeper understanding of React’s inner workings and build robust applications.